Matplotlib is one of the most popular library for data visualization and that’s for a reason. It has so many features to offer and can be used without any external software except python and the matplotlib library.
In this article, you will learn how to use matplotlib to visualize data that will also enable you to better understand the data, extract information, and make more effective decisions.
Before going further into matplotlib, let’s talk about Data Visualization
What is Data Visualization?
“A picture is worth a thousand words.” We are all familiar with this expression. It especially applies when trying to explain the insights obtained from the analysis of increasingly large datasets. Data visualization plays an essential role in the representation of both small and large-scale data.
Data visualization is the graphical representation of information and data. Graphical representation(in the form of charts, graphs, and maps etc) allows us to better understand the relationship in the data, data visualization tools provide an accessible way to see and understand trends, outliers, and patterns in data
One of the key skills of a data scientist is the ability to tell a compelling story, visualizing data and findings in an approachable and stimulating way.
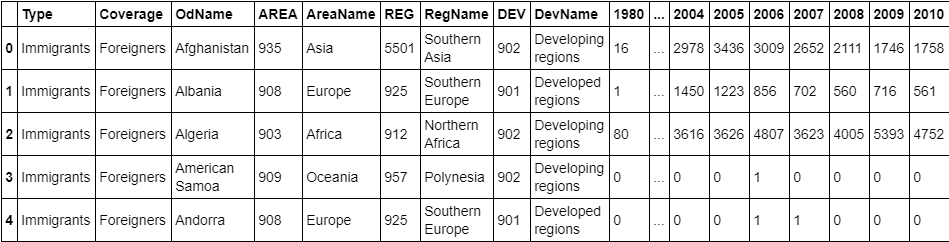
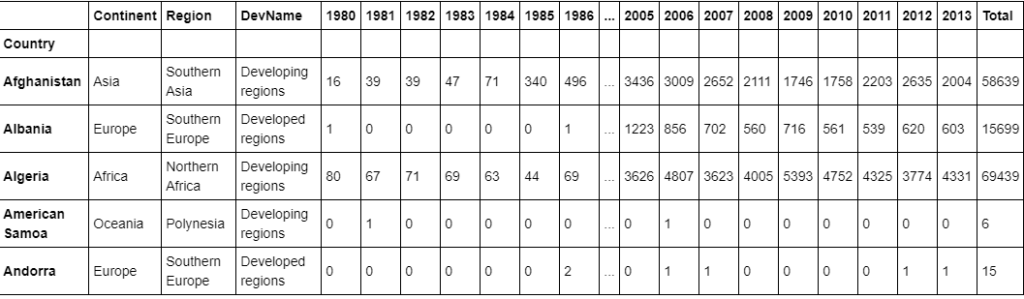
The dataset contains annual data on the flow of international immigrants as recorded by the countries of destination. The data presents both inflows and outflows according to the place of birth, citizenship or place of previous / next residence both for foreigners and nationals. The current version presents data pertaining to 45 countries.The dataset is available here.
Downloading and Preparing Data
import pandas as pd           #For reading the data

#Read the dataset skipping top 20 rows(irrelevant) and second last row
df_canada = pd.read_excel("./data/canada.xlsx",skiprows = range(20),skipfooter=2) df_canada.head() #View top 5 rows
#Check the dimensions of our canada dataset
df_canada.shape # (195, 43)
#Let gets insight of our dataset
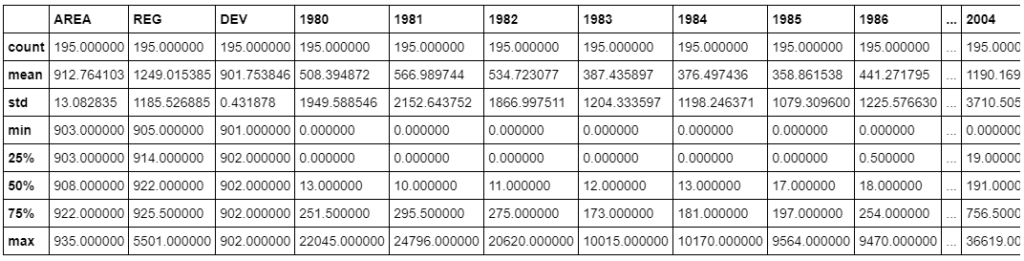
df_canada.describe()
Cleaning the Dataset
Remove columns that are not informative to us for visualization(eg., type, area, reg)
df_canada.rename(columns={"OdName":"Country","AreaName":"Continent","RegName":"Region"},inplace = True)
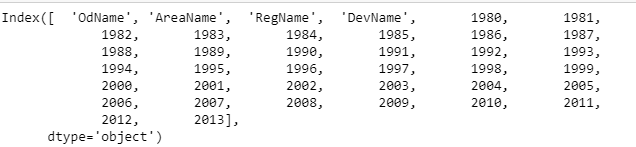
#View columns of our dataset
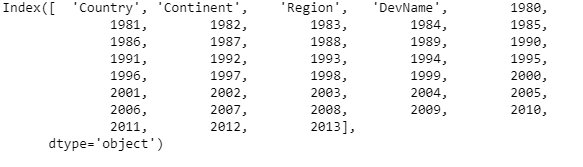
df_canada.columns
Check if column labels are string
For consistency, make sure that all column labels are of type string.
# let's examine the types of the column labels
all(isinstance(column, str) for column in df_canada.columns)
#False

df_canada.columns = list(map(str,df_canada.columns))
# let's examine the types of the column labels
all(isinstance(column, str) for column in df_canada.columns)
#True
Set the country name as index – useful for quickly looking up countries using .loc method.
df_canada.set_index("Country",inplace=True)
Add total column
#Add a column Total in our dataset containing
#total numbers of immigrants
df_canada["Total"] = df_canada.sum(axis=1)

#View top 5 rows
df_canada.head()
Visualizing Data using matplotlib
Now after we have cleaned the dataset, its time to draw some plots. Plotting data using Matplotlib is quite easy. Generally, while plotting they follow the same steps in each and every plot. Matplotlib has a module called pyplot which aids in plotting figure. The Jupyter notebook is used for running the plots. We import matplotlib.pyplot as plt for making it call the package module.
Installing matplotlib
Type !pip install matplotlib in the Jupyter Notebook or if it doesn’t work in cmd type conda install -c conda-forge matplotlib . This should work in most cases.
#import necessary modules
import matplotlib.pyplot as plt

# use the inline backend to generate the plots within the browser
%matplotlib inline
LINE PLOTS
What is Line Plot? When to use Line Plot?
A line chart or line plot is a type of plot which displays information as a series of data points called ‘markers’ connected by straight line segments. It is a basic type of chart common in many fields. Use line plot when you have a continuous data set. These are best suited for trend-based visualizations of data over a period of time.
Let’s Start with a Case Study
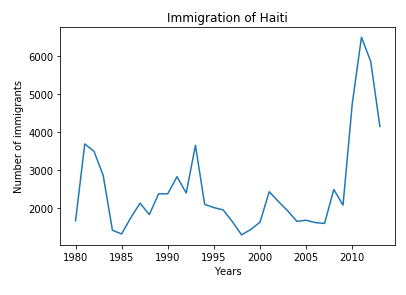
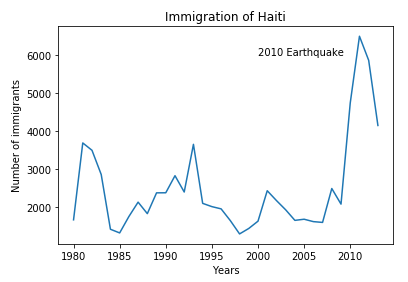
In 2010, Haiti suffered a catastrophic magnitude 7.0 earthquake. The quake caused widespread devastation and loss of life and aout three million people were affected by this natural disaster. As part of Canada’s humanitarian effort, the Government of Canada stepped up its effort in accepting refugees from Haiti. We can quickly visualize this effort using a Line plot:
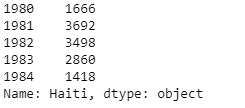
#First, we will extract the data series for Haiti.
years = list(map(str, range(1980, 2014)))
haiti = df_canada.loc["Haiti",years ]

# passing in years 1980 - 2013 to exclude the 'total' column
haiti.head()
pandas automatically populated the x-axis with the index values (years), and the y-axis with the column values (population). However, notice how the years were not displayed because they are of type string. Therefore, let’s change the type of the index values to integer for plotting.
haiti.index = list(map(int,haiti.index))
Also, let’s label the x and y axis using plt.title(), plt.ylabel(), and plt.xlabel() as follows:
haiti.plot(kind = "Line")     #Plotting the line
plt.title("Immigration of Haiti")
plt.xlabel("Years")
plt.ylabel("Number of immigrants")

plt.show() # need this line to show the updates made to the figure
We can clearly notice how number of immigrants from Haiti spiked up from 2010 as Canada stepped up its efforts to accept refugees from Haiti. Let’s annotate this spike in the plot by using the plt.text() method.
haiti.plot(kind = "Line")     #Plotting the line
plt.title("Immigration of Haiti")
plt.xlabel("Years")
plt.ylabel("Number of immigrants")

plt.text(2000,6000,"2010 Earthquake")
plt.show() # need this line to show the updates made to the figure
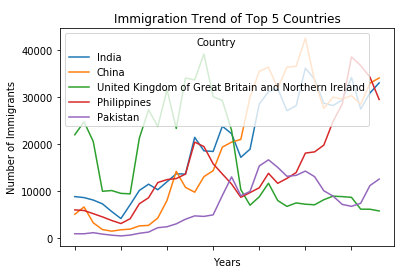
We can easily add more countries to line plot to make meaningful comparisons immigration from different countries.
Lets Compare the trend of top 5 countries that contributed the most to immigration to Canada.
#Sorting the dataset using sort_values() method
df_canada.sort_values(by = "Total",ascending  = False, inplace = True)

#Extract the data for top 5 countries
years = list(map(str,range(1980,2014)))
df_top = df_canada.head()

#Transpose the dataset
df_top=df_top[years].transpose()
df_top.head()
Now create a line plot and visualize the data
df_top.plot(kind='line')            #Plotting line

plt.title('Immigration Trend of Top 5 Countries')
plt.ylabel('Number of Immigrants')
plt.xlabel('Years')

plt.show()
Final Words
Thank you for the read. I hope that you have enjoyed the article. If you like it, share it with your friends. Also, I have a quick task for you to see how much you have learned. You can think of it as an assignment.
Task. COMPARE THE TREND OF LAST 5 COUNTRIES THAT CONTRIBUTED THE MOST TO IMMIGRATION TO CANADA.
I’ll be happy to hear your feedback. If you have some questions, feel free to ask them. 😉
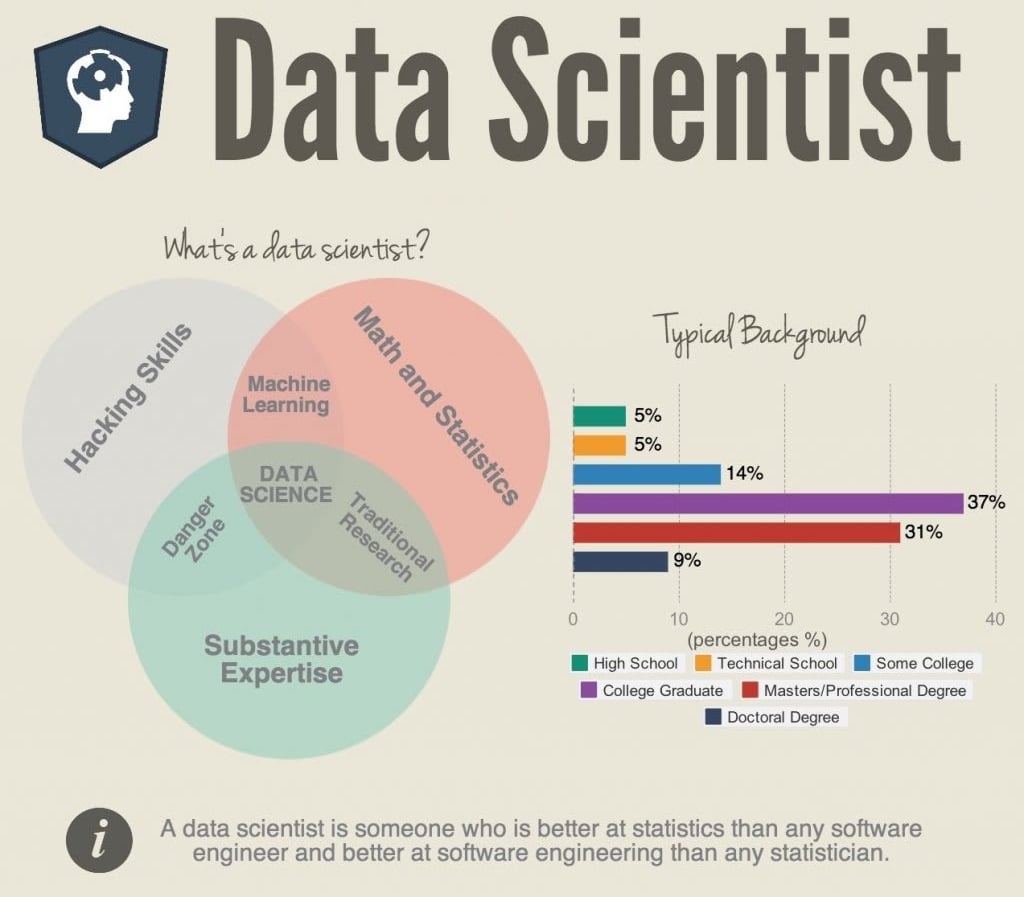
Hey Guys, this article is all about Data Science. You will get to know what is data science, what you have to learn to be a data scientist, what skills do you need, the job opportunities, and how you can become one. It will help you decide whether the Data Science field is for you or not.
So, without wasting any time, let’s dive in.
What is Data Science?
Data Science, in simple words, is a study of data. You use various tools and technologies to generate useful insights and information from the raw data. Though, it is not as simple as it sounds. To become a data scientist, you need to know your way around mathematics, programming, statistics, and patience.
What does a Data Scientist Do?
A data scientist has to identify issues use data to solve them to help the company in decision making. They typically analyze, process, and model data to interpret the results.
As a data scientist, you have to gain insights into the data, and for that, you may have to build algorithms, do statistical analysis, data mining, and data visualization so that you will be able to create solutions to increase business performance.
As a data scientist you will be making programs that include creating various machine learning-based tools or processes within the company, such as suggestion engines or lead scoring systems. You should also be able to perform statistical analysis.
The Path to Data Science
There are various things that you need to learn to become a data scientist.
Programming Languages
First, you need to learn Programming Language to communicate with the computer.
Python, R, and SQL are mainly used in Data Science. You can also use other languages for this, but these are widely used languages because they have a large number of libraries especially for this purpose. Like for python, there’s NumPy, Pandas, Matplotlib, Seaborn, SciPy, SkLearn, etc. These libraries make the job ten times easier. There’s a library for python for everything you need. You need graphs to visualize data? There’s matplotlib and seaborn. You need DataFrames, there’s Pandas. You need to perform vectorized operations on a big data set really fast? There’s NumPy for that.
The same is the case with R. With other languages, there are not many libraries and hence, Python and R are preferred over other languages.
To do anything with data first you need to have data.
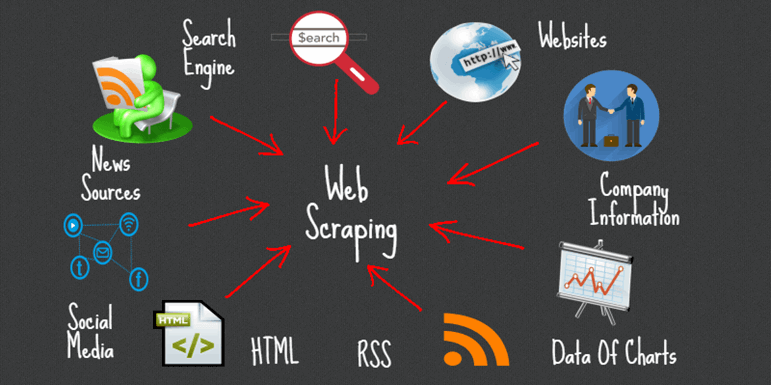
Data can be obtained through various sources. You will have to find them yourself but gathering and converting that raw data into useful data is something that you need to need to learn how to do. Sometimes, data is directly provided to you by the company/client you are working for, but most of the times you have to gather the data yourself.
There are some python libraries which can make the process easier. For example, suppose a website is providing public data in json format and you need that data to do work, now to use that data you first need to convert that data into the format that can be used for manipulation. To do that you need requests library. It helps you read and work with Json Data.
Similarly, there are cases where the website isn’t just giving out the data for free and you have to fetch the data, this is the part where web scraping comes into play. For example, suppose you have to fetch articles from Wikipedia, now Wikipedia doesn’t just give data in JSON format or RSS feeds, so to read the data, you need libraries like Scrapy, Beautiful Soup, etc. Learning how to automate the browser can also be handy to fully automate the process of fetching and converting the data for future uses.
Data Analysis and Visualization
Once you have the data you can start analyzing the data. Convert the raw data into dataframes using Pandas library.
Use libraries like Matplotlib and Seaborn to draw graphs. Make heatmaps, bar graphs, scatter plots. These graphs will help you understand the relationships in the data. What values are relevant, what values are irrelevant, what values can help related to the output you need. There are also tools like Power Bi by Microsoft and Tableau which can make the data visualization process easier.
You can check out these articles on NumPy and Pandas to get started with Data Science.
Introduction In this tutorial, you will learn the basics of NumPy Arrays from creating and working with NumPy Arrays to Indexing, Slicing, performing operations, joining and splitting of arrays. But first up we have a question that What is NumPy? NumPy is an open-source fundamental library for data science with Python. It stands for ‘Numerical […]
Introduction Hey Guys, this article will give you a quick introduction of pandas as to what is Pandas, why you should use Pandas, what can you do with Pandas, and the supported Pandas data types. It can help you make sure if Pandas is what you are looking for or you should learn pandas or […]
Machine Learning
Data Science doesn’t involve hardcore machine learning. That’s the job of a machine learning engineer. But you will be expected to know the basics and be perfect with algorithms. Having a great understanding of Neural Networks is, however, a plus point.
You have the data and you have already analyzed it. Now you need to make models that can be used to make predictions or perform particular tasks based on the data. All this comes under the machine learning territory. In most cases, as a data scientist, you will be required to make models that can predict some values based on the previous data that you provided. For that, you need to learn how to identify the type of problem(what type of problem you are solving) and the working of various algorithms. There are numerous algorithms that can be used to solve a particular problem but you need to choose the best one and for that, you need to be 100% sure about the type of problem and the category to which it belongs.
There’s no particular algorithm that works for all types of problems. An algorithm that works well with one dataset may not work with other datasets even if they are of the same category. Now I can go on and on about Machine Learning and algorithms but the post is not about that. We will go into detail when we talk exclusively about machine learning.
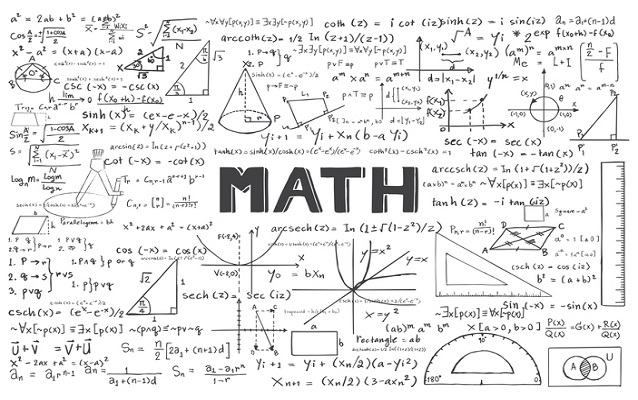
Mathematics
Yes, you need mathematics to become a full-fledged data scientist. Some people may argue that you don’t need mathematics to be a Data Scientist. It’s halfway true. You don’t need mathematics at the start of your career but you will need it as you grow. Simply put, to just learn and apply things, you don’t need mathematics but to understand the data on a deeper level you need to know mathematics. It will help you understand the relationship between the variables, whether they are linear or not, whether they will affect the outcome or not.
You need to be good in Statistics and Multivariate Calculus & Linear Algebra.
Mathematics allows you to understand what is happening with your data once you apply an algorithm. It can help you understand the working of the algorithm better and make the algorithm selection process easier.
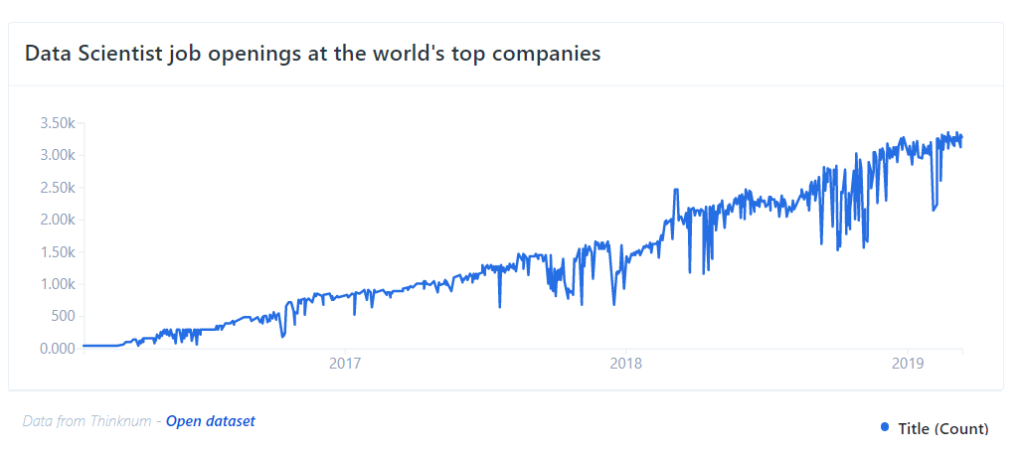
Career Opportunities in Data Science
The world is generating 2.5 quintillion bytes of data everyday! This simply means that the need of data scientists is only going to increase in future.
Data Science Trends
There’s a requirement of Data Scientist in almost every industry.
According to Glassdoor, a Data Scientist can make anywhere around $113,000/Year in US or ₹985K/Year in India on an average which is still one of the highest paying career paths.
Data Scientist isn’t the only job role in the data science industry. Here are some of the most popular data science job titles along with their average salary (According to Indeed and Glassdoor).
Data Science is not only the most lucrative career but also an interesting one to go after. As a data scientist, you will be able to experiment with data and machine learning techniques. It is really a fun job which also requires critical thinking skills and a business mind. Yes, it requires you to have certain skills like statistics, calculus, machine learning, etc, that may seem like a daunting task but once you perfect them, it is one of the best career paths you can take.
I guess this is at least enough to help you decide whether data science is for you or not.
Hey Guys, this article will give you a quick introduction of pandas as to what is Pandas, why you should use Pandas, what can you do with Pandas, and the supported Pandas data types. It can help you make sure if Pandas is what you are looking for or you should learn pandas or not.
If you’re looking for data science then you must have heard of this library at least once. Pandas is the most famous/downloaded library for data science. Why? Because it is super fast and makes working with datasets so much easier. We’re gonna talk about everything from series to DataFrames, from creating a new DataFrame to reading an old dataset everything.
Prerequisites
You should have a basic understanding of Python especially dictionaries, lists, and tuples. Some basic knowledge of NumPy will also be helpful as arrays are often used in Pandas Series and DataFrames along with the dictionaries. If you want to learn NumPy then check out our amazing tutorial on NumPy Arrays which covers everything that you need to know about NumPy.
What is Pandas?
Pandas is a high-performance open-source library for data analysis in Python developed by Wes McKinney in 2008. Over the years, it has become the de-facto standard library for data analysis using Python.
Why Pandas?
The benefits of pandas over using the languages such as C/C++ or Java for data analysis are manifold:
Data representation : It can easily represent data in a form naturally suited for data analysis via its DataFrame and Series data structures in a concise manner. Doing the equivalent in C/C++ or Java would require many lines of custom code, as these languages were not built for data analysis but rather networking and kernel development.
Data sub-setting and filtering : It provides for easy sub-setting and filtering of data, procedures that are a staple of doing data analysis.
Features of Pandas
It can process a variety of data sets in different formats: time series, tabular heterogeneous arrays, and matrix data.
It facilitates loading and importing data from varied sources such as CSV and DB/SQL.
It can handle a myriad of operations on data sets: sub-setting, slicing, filtering, merging, groupBy, re-ordering, and re-shaping.
It can deal with missing data according to rules defined by the user and developer.
It can be used for parsing and managing (conversion) of data as well as modeling and statistical analysis.
It integrates well with other Python libraries such as stats models, SciPy, and Scikit-learn.
It delivers fast performance and can be speeded up even more by making use of Cython (C extensions to Python).
Setting Up
Now, I’m not a big fan of Jupyter Notebook but it makes the data science easier to understand because you know exactly which block is executing which code.
Since most people find it difficult to use Jupyter Notebook standalone without Anaconda, We’ll stick to our old favorite – Default IDLE
Installing Pandas and JupyterLab
Now for those who do want to use Jupyter Notebook, if you have anaconda installed, it’s fine to skip the whole setting up section because Pandas comes pre-installed with Anaconda. If you don’t have Anaconda, continue reading
This is it, it will install Jupyter Notebook in your system. Also, you may also be aware that there’s a jupyter library too. We aren’t going to install that because it is no longer updated and this just gets the job done fairly well.
Check out this video. It might help you set up Jupyter Lab
Now, I won’t be explaining how to use Jupyter Notebook here in this tutorial because this is out of the scope of this tutorial. So, we’ll just get to the point. Open your terminal, cd to the path where you want to access files using Jupyter, and open Jupyter Notebook there. I will make a video on that in future tutorials but this article is about Pandas so we’re gonna skip that.
Now all you have to do is install Pandas. It is fairly easy to do so. Just open pip and type
pip install pandas
This will install pandas in your computer.
Syntax
The general convention is that you import pandas with an alias name pd. It is not necessary that you import it with this name but it is the recommended way to do it and you’ll find it this way in most of the places. So, it will improve readability of your code.
import pandas as pd
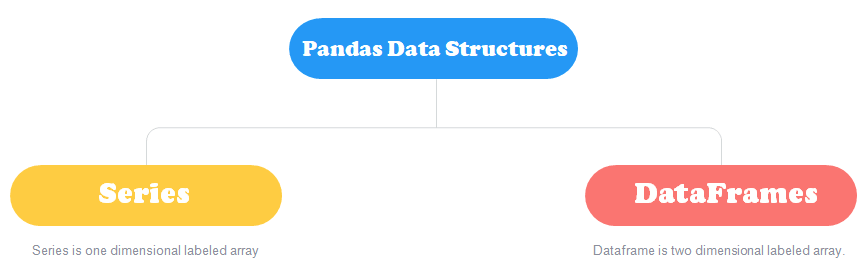
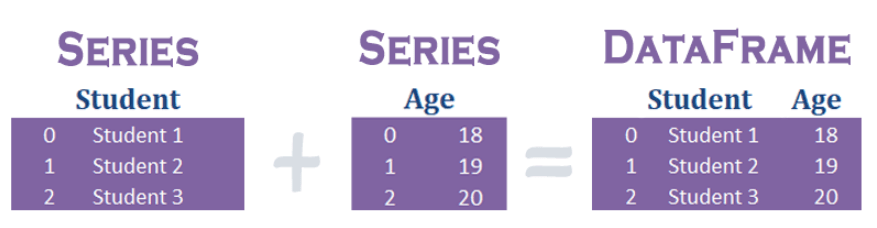
Pandas Data Structures
Pandas supports two main type of Data Structures. Series and DataFrames!
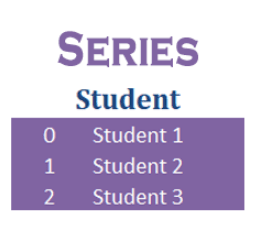
Series
Pandas Series is the one-dimensional labeled array just like the NumPy Arrays. The difference between these two is that Series is mutable and supports heterogeneous data. So Series is used when you have to create an array with multiple data types. Imagine a table, the columns in that table are Series and the table is a DataFrame.
Take a look at the image below. It will help you visualize better.
Series Example
Creating Series
Syntax for creating Pandas Series is:
import pandas as pd
s = pd.Series(data=None, index=None, dtype=None, name=None, copy=False, fastpath=False)
NOTE: ‘S’ of the pd.Series is capital. People tend to forget that.
This syntax may seem a little overwhelming but you do not need to focus on all the parameters. Most of the time you will only be using the data and index parameters but we will be discussing all the parameters here. But let’s first create example Series here.
import pandas as pd
s = pd.Series(["Coding Ground",1,5.8,True])
print(s)
Output will be:
0    Coding Ground
1                1
2              5.8
3             True
dtype: object
Now that we have a Series of consisting data of multiple datatypes, we can proceed further.
data: Sequence, most preferably list but can also be dictionary, tuple, or an array. It contains data stored in Series.
index: This is optional. By default, it takes values from 0 to n but you can define your own index values. Now there are two ways to define index,
s = pd.Series(["Coding Ground",1,5.8,True],index=["String","Integer","Float","Boolean"])
And it will work same as defining index in parameters. Output will be
1    Coding Ground
2                1
3              5.8
4             True
dtype: object
dtype: It is the datatype of the Series. If not defined, it will take values from the series itself. If it’s the same for all element, it will show a specific data type such as int else it will show Object.
name: It is the name given to your pandas series
s = pd.Series(["Coding Ground",1,5.8,True],index=["String","Integer","Float","Boolean"],name="Pandas Series")
It will add a name “Pandas Series” to your Series. The output will be
You can also do the same using s.name = “Pandas Series”
copy: It creates a copy of the same data in variable(s). By default it is set to False i.e., if you change the data in one variable, it’ll change in all variables wherever the data is stored. Change it to True and all the locations where the data is store will be independent of each other. For example,
s = pd.Series(["Coding Ground",1,5.8,True],index=["String","Integer","Float","Boolean"],name="Pandas Series")
ss = s
ss[1] = 2
print(ss)
print(s)
You can clearly see that even though you changed the value of the second element in ss, it automatically got changed in s. This is because copy by default is False. Set it to True
ss = s.copy()
ss[1] = 3
print(ss)
print(s)
This will create a new copy in ss and they will not share same data location point anymore. So, changing one will not change another.
fastpath: Fastpath is an internal parameter. It cannot be modified. It is not described in pandas documentation so you may have to take a look here.
DataFrames
DataFrame is the most commonly used data structure in pandas. DataFrame is a two-dimensional labeled array i.e., Its column types can be heterogeneous i.e. of varying types. It is similar to structured arrays in NumPy with mutability added. It has the following properties:
Similar to a NumPy ndarray but not a subclass of np.ndarray.
Columns can be of heterogeneous types e.g char, float, int, bool, and so on.
A DataFrame column is a Series structure.
It can be thought of as a dictionary of Series structures where both the columns and the rows are indexed, denoted as ‘index’ in the case of rows and ‘columns’ in the case of columns.
It is size mutable that means columns can be inserted and deleted
Suppose now you want to change the columns from “student” to “name of student” and from “Age” to “Age of Student”. You could do it easily as:
df.columns = ["Name of Student","Age of Student"]
And the output will be
           Name of Student  Age of Student
row1        Student1              18
row2        Student2              19
row3        Student3              20
So, this is it, we have covered all the parameters of DataFrames along with an example.
dtype: The datatype of Data in the DataFrame
copy: Same usage as Series, allows different location of same data.
We aren’t going to discuss the copy parameter here because that would require a lot of examples and new functions which are out of scope of this tutorial. We will be discussing these things in details in the future lessons.
Conclusion
Congratulations on completing this tutorial. It was your first step in deciding whether you should learn Pandas or not and since you’re reading this, you made the right choice.
Personally, I recommend learning Pandas because why not? It is the most powerful library and if data science is what you’re aiming for then you’ll see this library a lot.
You should set up Jupyter Notebook or preferably Anaconda. Use IDLE only if you can’t have Jupyter Notebook or Anaconda. IDLE will be a little bit slower when processing data compared to Anaconda but that’s fine. I mean you don’t necessarily need it but it will help you understand better. Also one more thing, remember that S of pd.Series and D of pd.DataFrame is in caps. People make that mistake a lot and their program fails.
So, now I want to ask you, can you make a DataFrame using Series? If yes, how? Comment down the answer below!
So, guys, this is it for this tutorial, we’ll be looking at more advanced topics in the future.
In this tutorial, you will learn the basics of NumPy Arrays from creating and working with NumPy Arrays to Indexing, Slicing, performing operations, joining and splitting of arrays. But first up we have a question that
What is NumPy?
NumPy is an open-source fundamental library for data science with Python. It stands for ‘Numerical Python’. NumPy was developed by Travis Oliphant in 2005. It is what you can say is a sequel to Numeric and Numarray. It’s a fast and powerful library for working with multidimensional arrays and matrices. As it provides a large number of functions to work with those arrays.
It is generally used in Data Science along with Python Pandas and Matplotlib.
NumPy is a really fast library and it is easy and fun to use as compared to Lists or Tuples. We’ll get into those details later in this tutorial. If you are new to NumPy then make sure to read the whole article as we are going to cover all important functions of NumPy extensively. We’ll try to be as concise as possible and this article will be everything you will ever need for NumPy.
Prerequisites
You should have a basic understanding of python 3. You must have a basic understanding of working with lists and slicing.
The Audience
Beginners: This tutorial is made for beginners so that they can learn NumPy Arrays from scratch up to a standard level. We have only covered the handy and the necessary functions in this tutorial. We tried to avoid any advanced stuff but if you do encounter something that you do not understand please do not hesitate to ask in the comment section. There are some sections that you might find confusing if you are just starting up but you will get the hang of it with some practice.
TIP: Open your Python IDE and try the in-between code examples that are in this tutorial as you read the topic. And, instead of copy-pasting and checking the output, type the code yourself for better understanding. It will help you a lot, I mean a LOT!
People with Basic NumPy Experience: This tutorial can be a solid recap of all the necessary things you need to know or already know about NumPy. Do not read all the stuff, just take a quick look at the table of content and read whatever you might find interesting.
Setting Up
Numpy doesn’t come preinstalled with the default python install. Now there are some specifically designed programs for data science with python that make the processing faster so you might want to consider them as well.
Choosing the IDE(Integrated Development Environment)
People tend to use Anaconda with Jupyter Notebook(It comes pre-installed with Anaconda) because it’s way faster than the default IDLE and it’s simple to use. I would not recommend the use of Jupyter Notebook alone, so if you are going for Jupyter Notebook then install Anaconda or Miniconda at least. But for the sake of simplicity, we will stick to idle. You can use any ide as the procedure will be similar in all of them.
Sublime Text is a fast and lightweight text editor plus its color schemes make it a much better choice than using any of the other IDE’s. Besides Sublime Text, I also recommend Visual Studio Code. Visual Studio Code is lighter than the original Visual Studio and it has all the functions which you’ll be needing.
Installing Numpy in Preferred IDE
To install Numpy on idle just open pip and type in the following command.
pip install numpy
That’s pretty much it. This will install the latest stable version of numpy available on your default python install.
Numpy comes pre-installed with Anaconda.
But if you are planning to work in a virtual environment then you have to install NumPy separately for that environment. Installing in a virtual environment is also the same as installing in a new python install. You have to use pip.
Working with Numpy Arrays
Arrays are the arrangement of data in tabular form i.e., in the form of rows and columns.
The Syntax(For Beginners)
As per the recommended sign convention, numpy package is imported as
import numpy as np
That’s just the basic sign convention that you’ll see almost everywhere where NumPy is used.
Now the most common function of the numpy package is array. Array takes a number of parameters as an input.
It can seem overwhelming at first because of all those parameters but let me tell you one thing that not all of them are necessary for working with arrays. In fact, except for the object parameter, everything else is optional. We’ll talk briefly about each of them now:
Object: It is the sequence you want to pass into an array.
dtype: The data type of the resultant array.
copy: By default it is true. It returns an array copy of the given object.
order: C (row-major) or F (column-major) or A (any) (default). For better understanding check out this answer on StackOverflow
subok: It is used to make a subclass of the base array. By default it is turned off, so, the output array is the base array.
ndmin: Specifies the minimum dimensions of the final array
Now, for example, if you want to use arrays, you can use it like
>>>import numpy as np
>>>np.array([1,2,3])
array([1,2,3])
The Output will be
array([1,2,3])
In this example, we passed a list as an object into the array function and the output will be an array because the copy function is set to True by default.
You can also pass a nested list,tuple or dictionary into an array
Also if you want to import just a single function of that package you can do that as:
>>>from numpy import array
>>>array([1,2,3])
This way you only import a particular function of that package and not the whole package. This is generally avoided because it makes the code confusing as you may not be able to find from what package or module is it imported from. Also if you have already made a function with this name it then it makes the code even more confusing.
Creating NumPy Arrays
There are many functions that are specifically used to create arrays. We will discuss all the important ones in this article
np.array()
This is the standard function to create array in numpy. You pass a list or tuple as an object and the array is ready. We have already discussed the syntax above.
np.arange()
It is similar to the range() function of python. It runs through particular values one by one and appends to make an array.
np.arange(start,end,stride)
start: the starting number is optional to enter as it is 0 by default.
end: this is the ending number to which an array will run. Remember that array will run till end-1 element.
stride: it is the number of steps you want to skip.
>>>np.arange(1, 10, 3)
The Output will be
array([1, 4, 7])
In the above example, the starting position is 1, ending is 10 and the stride is 3. Therefore, it will run till 9 and prints every third element.
np.zeros()
This helps to create a quick array of zeros of specified order.
>>>np.zeros((3,3))
The Output will be
array([[0., 0., 0.],
       [0., 0., 0.],
       [0., 0., 0.]])
This is used if you want to create the array to be used later for number storing purposes.
Like for example, if you are making a game then you’d want starting attributes of a character to be zero and increase as it further progresses in the game.
np.ones()
It is same as np.zeros(), it just replaces zeros one ones
>>>np.ones((3,3))
The Output will be
array([[1., 1., 1.],
       [1., 1., 1.],
       [1., 1., 1.]])
np.empty()
It creates an array of garbage content. Its values are random.
This is only used because it is faster than np.zeros and np.ones. This is due to the reason that all the values are random and not specified.
np.linspace()
The linspace() function returns an array of evenly spaced numbers. For example
>>>np.linspace(3,9,3)
The Output will be
array([3., 6., 9.])
In the above example, the resultant array contains 3,6 and 9. This is because we made the starting point as 3 and end point as 9 and we want 3 evenly spaced numbers between them. This is simple math, what are 3 evenly spaced numbers between 3 and 9(including both)? They are 3,6 and 9.
More functions of creating arrays
Though we have covered all the important functions which are used to create arrays there are even more of them. You probably won’t be needing any other function for creating arrays but if you are curious about other functions then you can take a look at this page on official SciPy documentation.
NumPy Array Attributes
Numpy arrays have various attributes that can make working with them easier. They help in organizing data in fast and convenient ways. We will be discussing only the most important attributes of the array.
np.array().shape and np.array().reshape()
These attributes helps to determine the order of the array and allow changes in them.
For example,
>>>import numpy as np
>>>cg = np.array([[1,2,3],[1,2,3]])
>>>cg.shape
The Output will be
(2,3)
np.array.shape returns the tuple of the order of the array. You can change its order as
>>>cg.shape = (3,2)
>>>cg
The Output will be
array([[1, 2],
       [3, 1],
       [2, 3]])
Notice that the order of the array changed from 2 rows and 3 columns to 3 rows and 2 columns.
You can also do the same thing using the reshape function. For example:
Note: We do not use parenthesis with .shape but we do with .reshape(). This is because .shape is an attribute of the array while .reshape() is a function of array.
Tip: Make sure that the multiplication of the order of an array is equal to the number of elements. Else it will not work. For example, in our previous example, we have 30 elements and the order we defined was (5,2,3) i.e, 5*2*3 = 30.
ndim
This shows the dimension of the data in the array. For example
>>>a = np.array([[1,2,3],[1,2,3]])
>>>a.ndim
The Output will be
2
itemsize
This attribute tells the size of the datatype of the data stored in the array.
>>>a = np.array([[1,2,3],[1,2,3]])
>>>a.itemsize
The Output will be
4
Indexing and Slicing Arrays
Array Slicing is no different than list or string slicing in particular. So, if you are familiar with slicing then you’ll understand it in no time.
1D Arrays
Working with 1D Arrays is very simple. You just have to select the index number and you are done.
cg = np.arange(1,6)
print(cg)
This creates an array of 5 elements from 0 to 4
[1 2 3 4 5]
Now to select an element from it just type cg[element-index]. For example, if you want to select element 3 from it then all you have to do is
cg[2]
The output will be 3. This is because index starts from 0.
Suppose you want to select every element starting from 2 in this array. Then
print(cg[1:])
The Output will be
[2 3 4 5]
2D Arrays
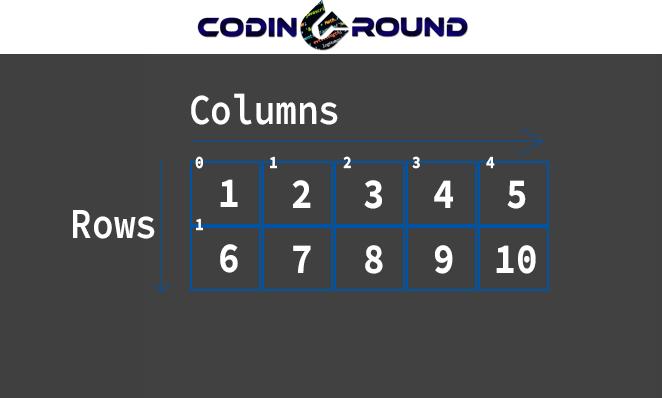
a = np.array([[1,2,3,4,5],[6,7,8,9,10]])
We have created a two dimension array. Look at the image below for better understanding of how it works
Indexing in 2D array is slightly different than 1D Array. It is written like
So you first have to select the row of the element and then you select its column.
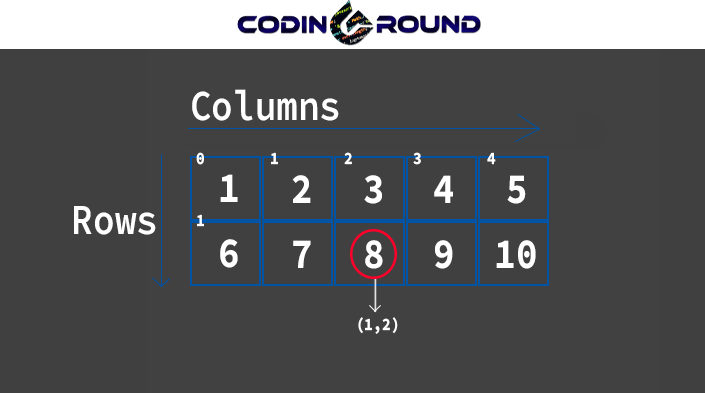
Suppose if you want to select 8 from the array then you first select its row which is 1 since it is in the second. Row and column which is 2 since it is third column
cg = np.arange(1,11).reshape(2,5)
print(cg[1,2])
Now if you want to print all the elements of the first row then you can do this by
a = np.arange(1,11).reshape(2,5)
print(a[0,:]
The Output will be
[1 2 3 4 5]
This is because you selected 1st row which is at index 0 and empty:empty which represents that you select from 0 to end with stride 1. These are default values.
These are the basics of slicing and indexing. There’s a lot to slicing but it’s all practice. You will only understand slicing when you experiment with it.
Joining Arrays
You can also join two or more arrays into a single new array. Let us consider two arrays
a1 = np.array([1,2,3])
a2 = np.array([4,5,6])
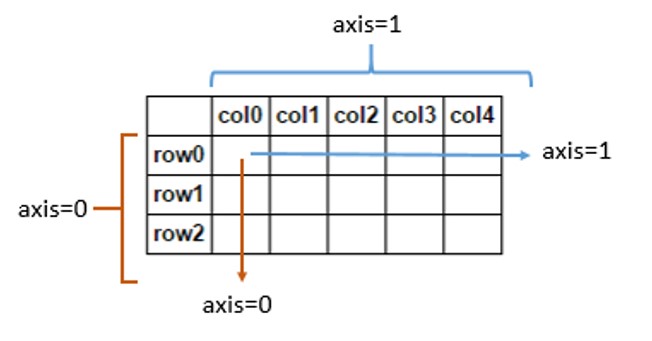
In NumPy there’s a function named concatenate() which allows us to join the arrays both horizontally and vertically. Though it must satisfy the condition.
It takes 3 parameters
np.concatenate((sequence),axis,out)
Sequence: The list or tuple of arrays that you want to concatenate.
Axis(Optional): How do you want to join? Along rows or columns? By default, the axis is 0 which is rows. To join along with columns, you can change it to axis=1.
Out(Optional): If provided, the destination to place the result. The shape must be correct, matching that of what concatenate would have returned if no out argument were specified.
print(np.concatenate((a1,a2),axis=0))
The Output will be
[1 2 3 4 5 6]
Below is an image which can help you visualize axis
source: stackoverflow
Since it is a 1D Array, you can only join it in one way. If we create a 2D Array, then you will be able to join it along with both rows and columns provided it has the same number of rows or columns.
Joining along axis=0 or vstack()
For example, you cannot join an array which has 1 row with an array which has 2 rows.
You can also achieve this by using the vstack() function.
np.vstack((a1,a2))
Joining along axis=1 or hstack()
Further, if you want to join them along with columns then you can change the axis to 1. Since both arrays have the same number of rows, then you can join them along columns
You can also achieve this using the hstack() function.
np.hstack((a1,a2))
In the example, we took only 2 arrays and concatenated them but you can join as many arrays as you want. If you are starting out as a beginner, it will be more than enough for you for now. I’ll be making in-depth tutorials on each of these topics soon.
Splitting Arrays
You can also split an array into two or more arrays and store them differently. There are several functions for splitting arrays too.
The most common of them is the split () function.
split(array, indices_or_sections, axis=0)
Array: The array you want to split
Indices or Sections: Index numbers from which you want to split the array or the number of sections you want your array to split. I would recommend using sections unless it is necessary to use indices.
Axis: By which axis you’d want to split(by default it is 0).
In the case of a 1D array, you don’t really have a choice as to how you want to split it. You can only choose from which element you want to split. Let us consider a 1D array
a = np.arange(4)
Now we have an array of 4 elements. If we want to split it into two then
print(np.split(a,2))
The Output will be
[array([0, 1]), array([2, 3])]
But this function isn’t really much helpful when you are not sure about how much elements you have in array. Because it splits the elements evenly into new arrays.
For example, if you try to split this array into 3 parts then it will throw an error. To prevent that, we have another function named array_split(). Just replace split() with array_split() and it will work fine.
b = np.array_split(a,3)
print(b)
The Output will be
[array([0, 1]), array([2]), array([3])]
You can also store each array into a new variable for example
c = b[0]
d = b[1]
e = b[2]
print(c)
print(d)
print(e)
The Output will be
[0 1]
[2]
[3]
Split() is only used because it is a little faster in comparison to array_split()but it doesn’t make much of a difference in time. I would recommend using array_split() as it reduces the chances of errors.
Splitting along axis=0 or vsplit()
Let us consider a two dimensional array. We will be splitting this array along axis 0 i.e., splitting along rows.
 a1 = np.arange(1,13).reshape(2,6)
b = np.array_split(a1,2)
You can also achieve this using the hsplit() function.
np.hsplit(a1,2)
In the above example, we only split a 2D array but you can also split arrays of higher dimensions. Since it will increase the complexity to an intermediate level, we are not going to include that in this tutorial.
Comparison: Arrays, Lists and Tuples
1. Vectorized Operations: One of the main differences between Arrays, Lists, and Tuples is vectorized operations. Only Arrays allow vectorized operations i.e. when you apply a function it gets applied to each element of an array and not to array itself.
If you try the same with list or tuple it will throw a traceback error, for example:
>>>cgt = (1,2,3,4)
>>>cgt += 1
Traceback (most recent call last):
  File "<pyshell#11>", line 1, in <module>
    cgt += 1
TypeError: can only concatenate tuple (not "int") to tuple
2. Data Type Declaration: Arrays need to be declared while list, tuples, and dictionaries, etc. do not need to be declared i.e., if you want to use arrays then you have to declare them using the .array() class while you do not have to do it with lists or tuples.
3. Mutability: Mutability means the ability to be changed. Data inside arrays can be changed while the data in a tuple cannot be changed or modified.
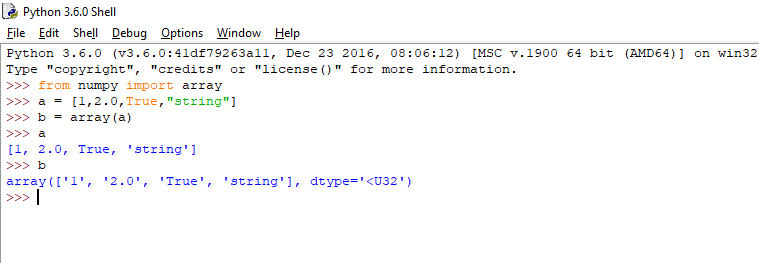
4. Heterogeneous Data: While arrays, lists, and tuples all are used to store data, arrays cannot store heterogeneous data.
If you observe carefully, the list I passed in array has each element of different data type but when printed as an array, it converted all the data as “string”. This is not the case with lists or tuples.
Array
List
Tuple
Vectorized Operations
Yes
No
No
Mutability
Yes
Yes
No
Pre-Defined Data Type
No
Yes
Yes
Heterogeneous Data
No
Yes
Yes
Features of Arrays, Lists and Tuples
When and when not to use Arrays?
When to use Arrays:
You have to store a large amount of data.
The data you want to store is of the same type.
You may perform operations on each element.
When not to use Arrays:
The Data Type is different
The data is very small
You do not have to perform operations on each element.
Highlights
First of all, congratulations on making it to the end. Now, this tutorial doesn’t really need a recap as it was kind of an overview so that you can get the hang of it. So I’ll just go through the most important of these functions which are a necessity for using NumPy.
For creating arrays, the most important functions are arange() function and the standard array() function. You may also need zeros() or ones(). I highly doubt that you will be needing any other function.
.shape is the single most important attribute of the array that you should know about. And, for adjusting shapes the .reshape() function may come in handy. It is easier to use than changing arrays shape using shape attribute.
With concatenate() function you will need to specify the axis whereas with hstack() and vstack() you do not need to type the axis. You can use either but using hstack() or vstack() may help in in future to remember the axis.
array_split() adjusts the array split according to the parameters whereas split() will throw an error if the parameters are not proper. So use array_split(). In most cases it’s a win-win. With array_split() function you will need to specify the axis whereas with hsplit() and vsplit() you do not need to specify the axis.
I guess I have covered everything important. Know that there are some sections where you might get confused if you are a first-timer. Please don’t hesitate to ask in the comments section. I will try to answer each and every comment. So, that’s all.